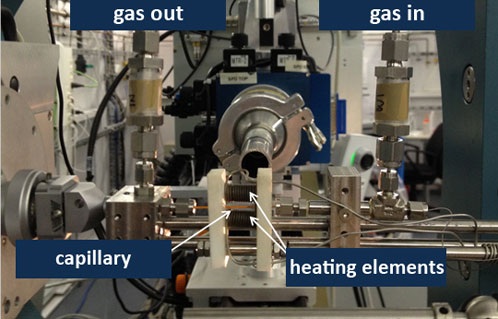
The construction and commissioning of the cell has been the result of the collaboration of a group of researchers of the Spanish community: Laura Barrio (from EQS group at ICP), Fernando Rey's group (from ITQ) and Atsushi Urakawa's group (from ICIQ) with the scientific staff of the MSPD beamline. The design is based on the design by Peter Chupas et. al.J. Appl. Cryst. (2008). 41, 822–824
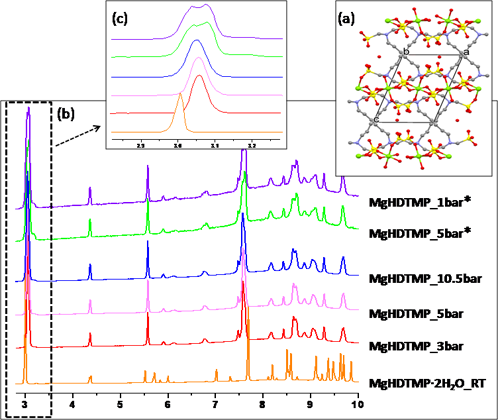
This first user experiment of the cell has consisted in the in-situ structural characterization (by powder diffraction) of MOF-like metal phosphonates conducted under high CO2 pressure. The research group of Dr. Cabeza, from the Department of Inorganic Chemistry (Universidad de Málaga) has studied the structural changes occurring in situ upon CO2 uptake, conducted from 1 to 14 bar. Among the variable responses to CO2 adsorption found, it is highlighted the high structural flexibility of Mg[(HO3PCH2)2N(H)(CH2)6N(H)(CH2PO3H)2].2H2O (MgHDTMP.2H2O) to accommodate CO2 guest molecules. The 3D pillared open-framework (Figure 2a) exhibits a permanent splitting of the diffraction peaks upon CO2 uptake, attributed to different conformations of the pillaring alkyl chains (Figure 2b and c).

Fig. 1: The ICP-ITQ-ICIQ-ALBA capillary flow cell installed at the MSPD beamline, in the powder diffraction endstation.

Fig. 2: (a) View of the crystal structure of MgHDTMP.2H2O along the b-axis. (b) X-ray diffraction patterns at different CO2 pressures. The inset (c) shows the evolution of the peaks during the CO2 adsorption-desorption. (*desorption).


