After surface preparation, the Magnetite crystal shows atomically flat terraces separated by monoatomic steps as seen in the low energy electron microscopy (LEEM) image in Fig. 1(a), showing mainly topographic contrast.
The clean surface presents a reconstruction with two different domains (2x1 and 1x2), which can be readily detected by surface electron diffraction (LEED). Using a particular diffracted beam, the dark-field image in Fig. 1(b) is obtained in the same area, now highlighting surface structural contrast (reconstruction).
Using photoelectrons excited by X-rays tuned to the Fe-L3 absorption edge, information about the magnetic domains and of the electronic states of the different Fe cations in the Fe3O4 ferrimagnet is gathered. For example, Fig. 1(c) shows magnetic domains, again in the same zone, imaged by X-ray circular magnetic dichroism (XMCD-PEEM). The corresponding image based on the linear dichroism effect (XMLD) is shown in Fig. 1(d). The two different inset arrows indicate the relation between the image grayscale and the local direction of magnetization. XMLD imaging is of particular interest for the investigation of antiferromagnetic materials where the XMCD effect cancels out.
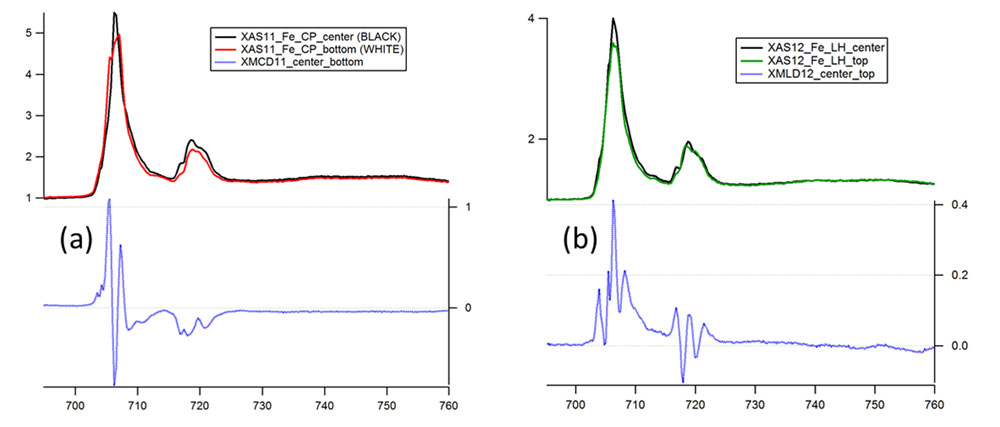
Analyzing images with different incoming photon energy, the X-ray absorption spectra (XAS) for individual, micron-sized domains are extracted. These spectra are shown in Fig.2 (a)&(b) (top panels) together with the resulting XMCD (in Fig. 2(a) ) and XMLD (in Fig. 2(b) ) spectra (lower panels). Apart from the high spatial resolution, another advantage is that by comparing different domains, the complete difference spectra can be obtained in a single energy scan without polarization switches.

Fig. 1: LEEM and X-PEEM images in the same area of a Fe3O4 (100) surface (field of view 20um): (a) Low energy electron microscopy image showing topographic contrast and (b) dark field electron image showing areas with different surface reconstruction. (c)&(d) X-PEEM images at the Fe-L3 absorption edge , combining different circular photon polarization (c) to obtain XMCD contrast and different photon energies at linear polarization (d) to obtain XMLD contrast. In (c) and (d) the grayscale corresponds to the local magnetization direction as indicated by the inset arrows.

Fig. 2: X-ray absorption spectra extracted from spectromicroscopy stacks for circularly (a) and linearly (b) polarized photons and two oppositely magnetized domains. The resulting XMCD (a) and XMLD (b) spectra are shown in blue.


